Race analysis
Every race gets its own page: splits, goal progress, and the training that led into it, including whether your practice test sets actually predicted the result.
Splits & goal alignment
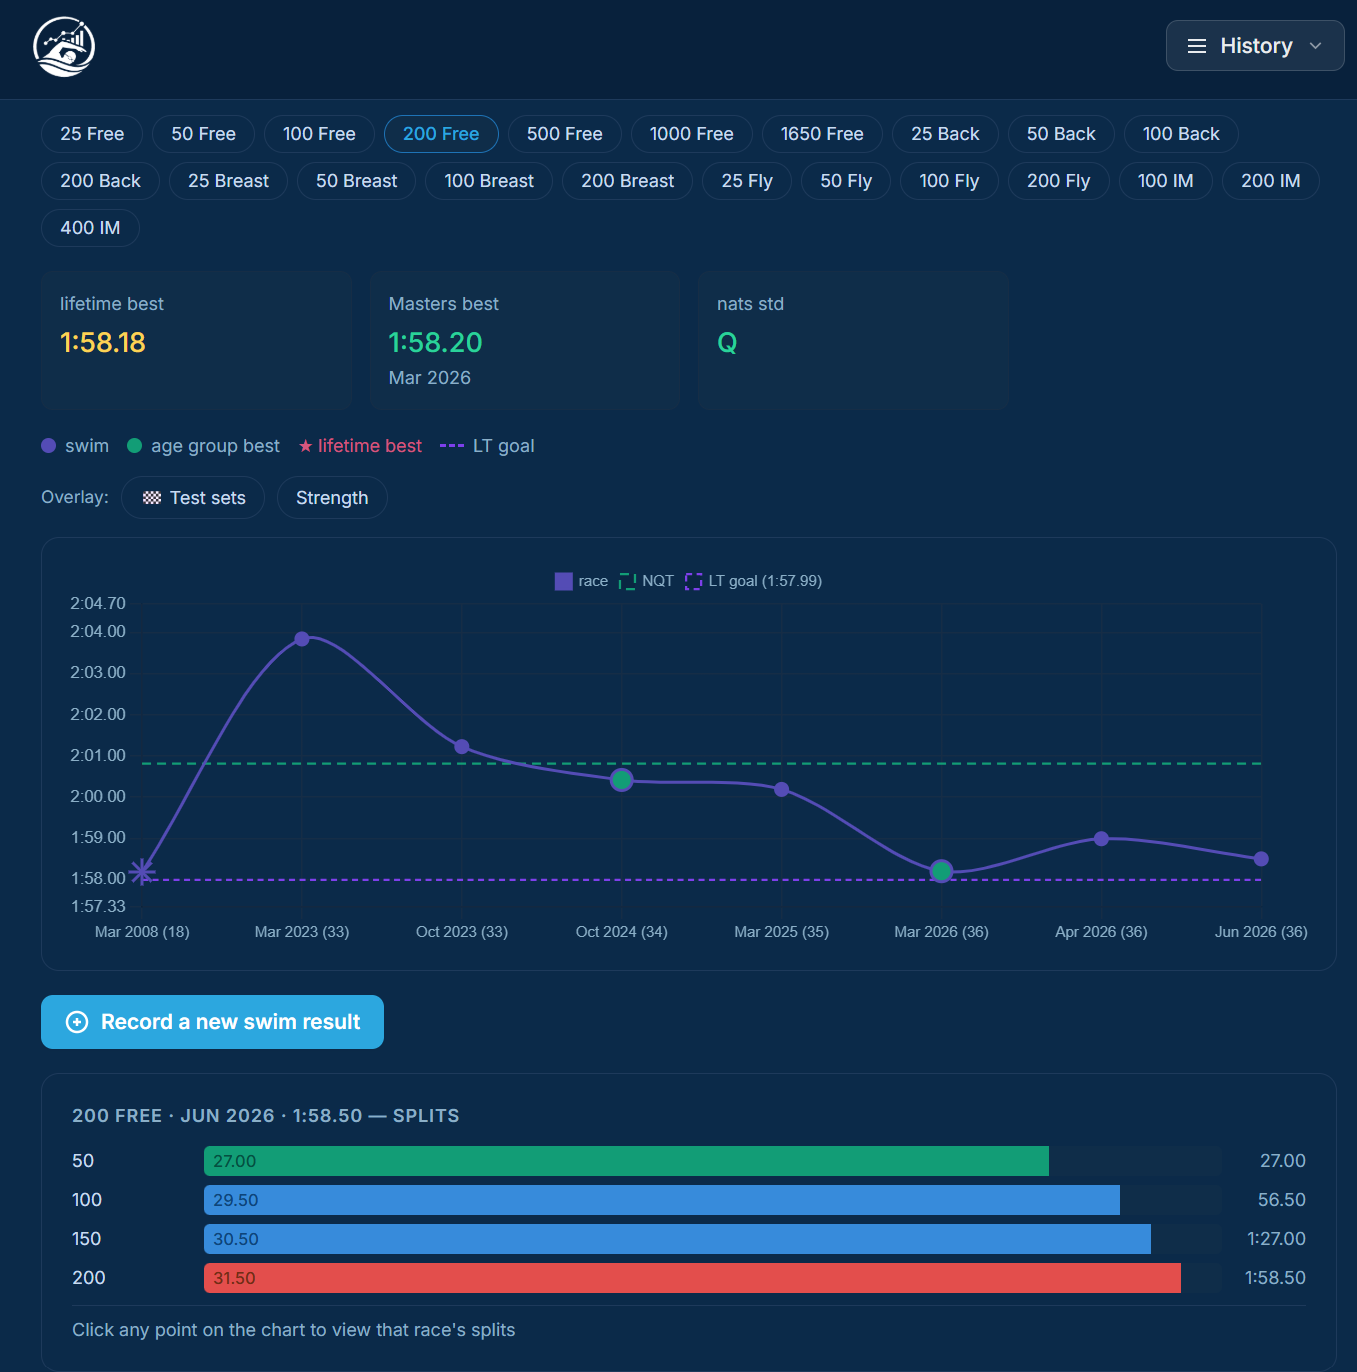
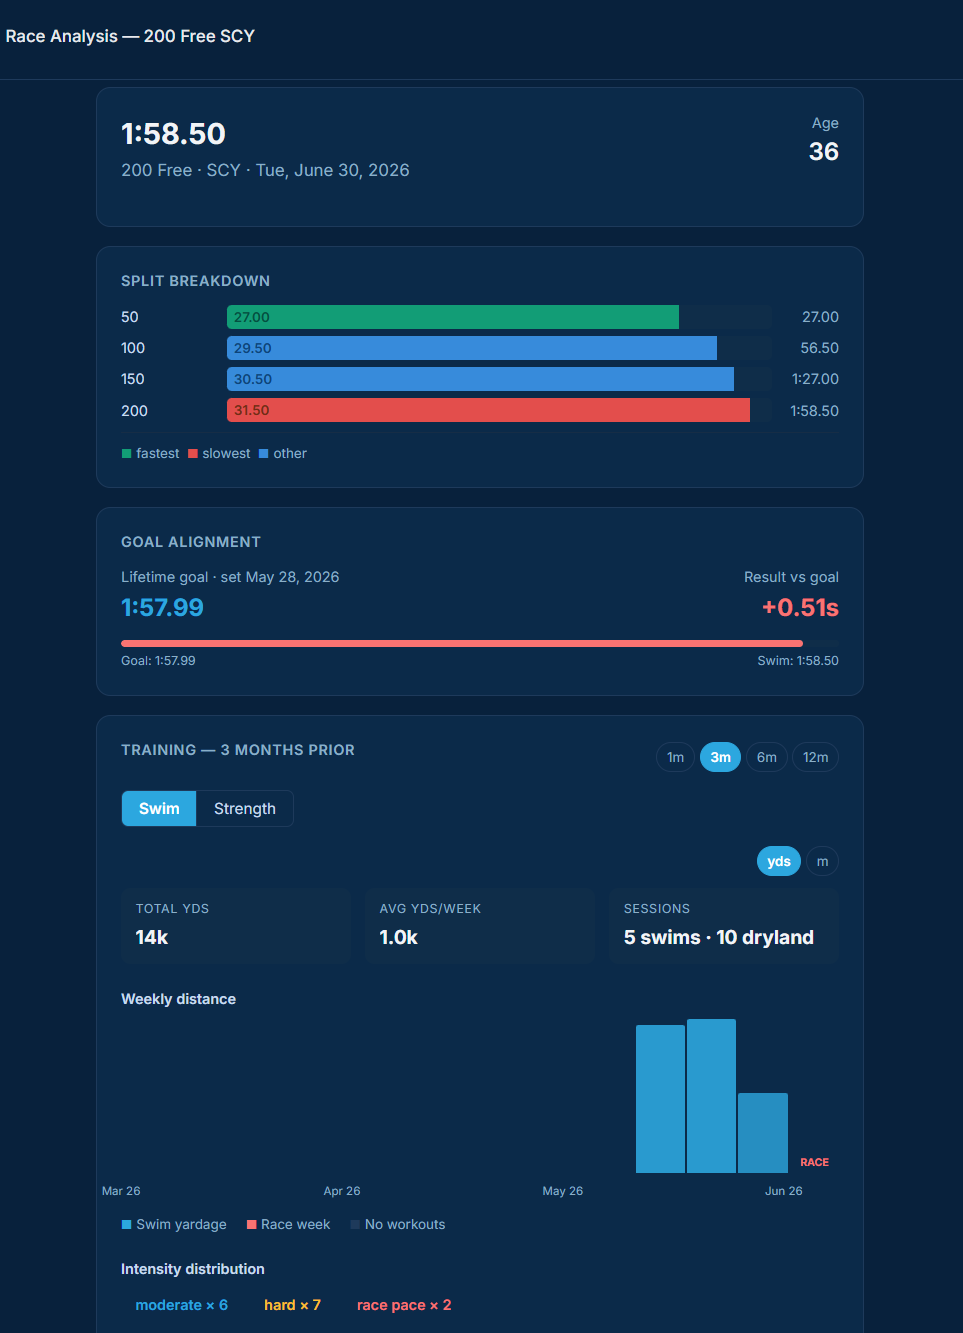
Each race shows a split breakdown chart alongside whatever goal was active at the time, so you can see exactly where a race gained or lost time against your target, not just the final result.
Training leading into the race
A rolling window of the months before the race: weekly yardage, intensity distribution, and (if you're tracking lifts) strength trends, so you can connect a result back to what you actually did in training, not just guess.
Race test sets
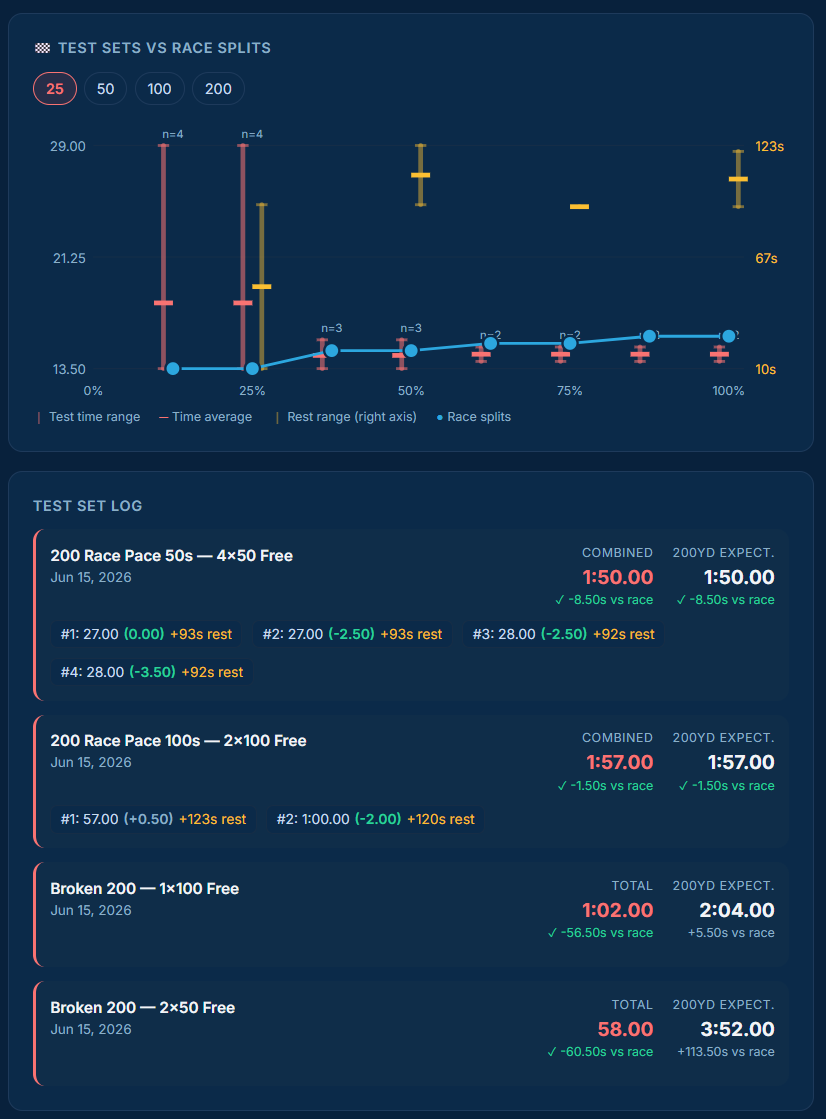
If a workout set is flagged as a race test (say, a broken 200 done in practice), Swimalysis lines those practice times up against the actual race splits, plotted by percentage of race distance, so an 8×25 test set and a 2×100 test set can both compare meaningfully against the same race.